How to create dashboards in Airtable
Hugo Nunes • Updated on Oct 24, 2023 • 13 min read
Whether you're a project manager, a business owner, or someone looking to streamline your personal life, having a centralized data hub can be a game-changer. You can count on Airtable, a versatile database tool that combines the simplicity of a spreadsheet with the power of a relational database.
In this guide, I’ll guide you through two methods for creating dashboards with Airtable data:
- Create dashboards in Airtable, so that you can learn how to use Airtable's native features to build your dashboards, which is ideal for those looking for a cost-effective solution with no additional tools;
- Create dashboards with Softr and Airtable, allows you to learn that you can integrate Airtable with Softr to build dynamic and feature-rich dashboards with granular access permissions.
Creating dashboards in Airtable
With this method, you’ll use Airtable’s native features to create a graphic interface within 15 minutes. This method is cost-free because you can do so using Airtable's free plan.
If you already have your data in an Airtable base, you can move directly to Step 2.
Step 1: Access and copy the template
To streamline the dashboard creation process, the Airtable base we are using is a Sales CRM Template provided by Softr. If you don’t have your own database in Airtable yet, copy the template to your workspace, by clicking on “Copy base” on the top of the page.
A new window or tab will open and Airtable will prompt a window where you should select the workspace where you want this base to be installed. After choosing the destination workspace, click on “Add base.”
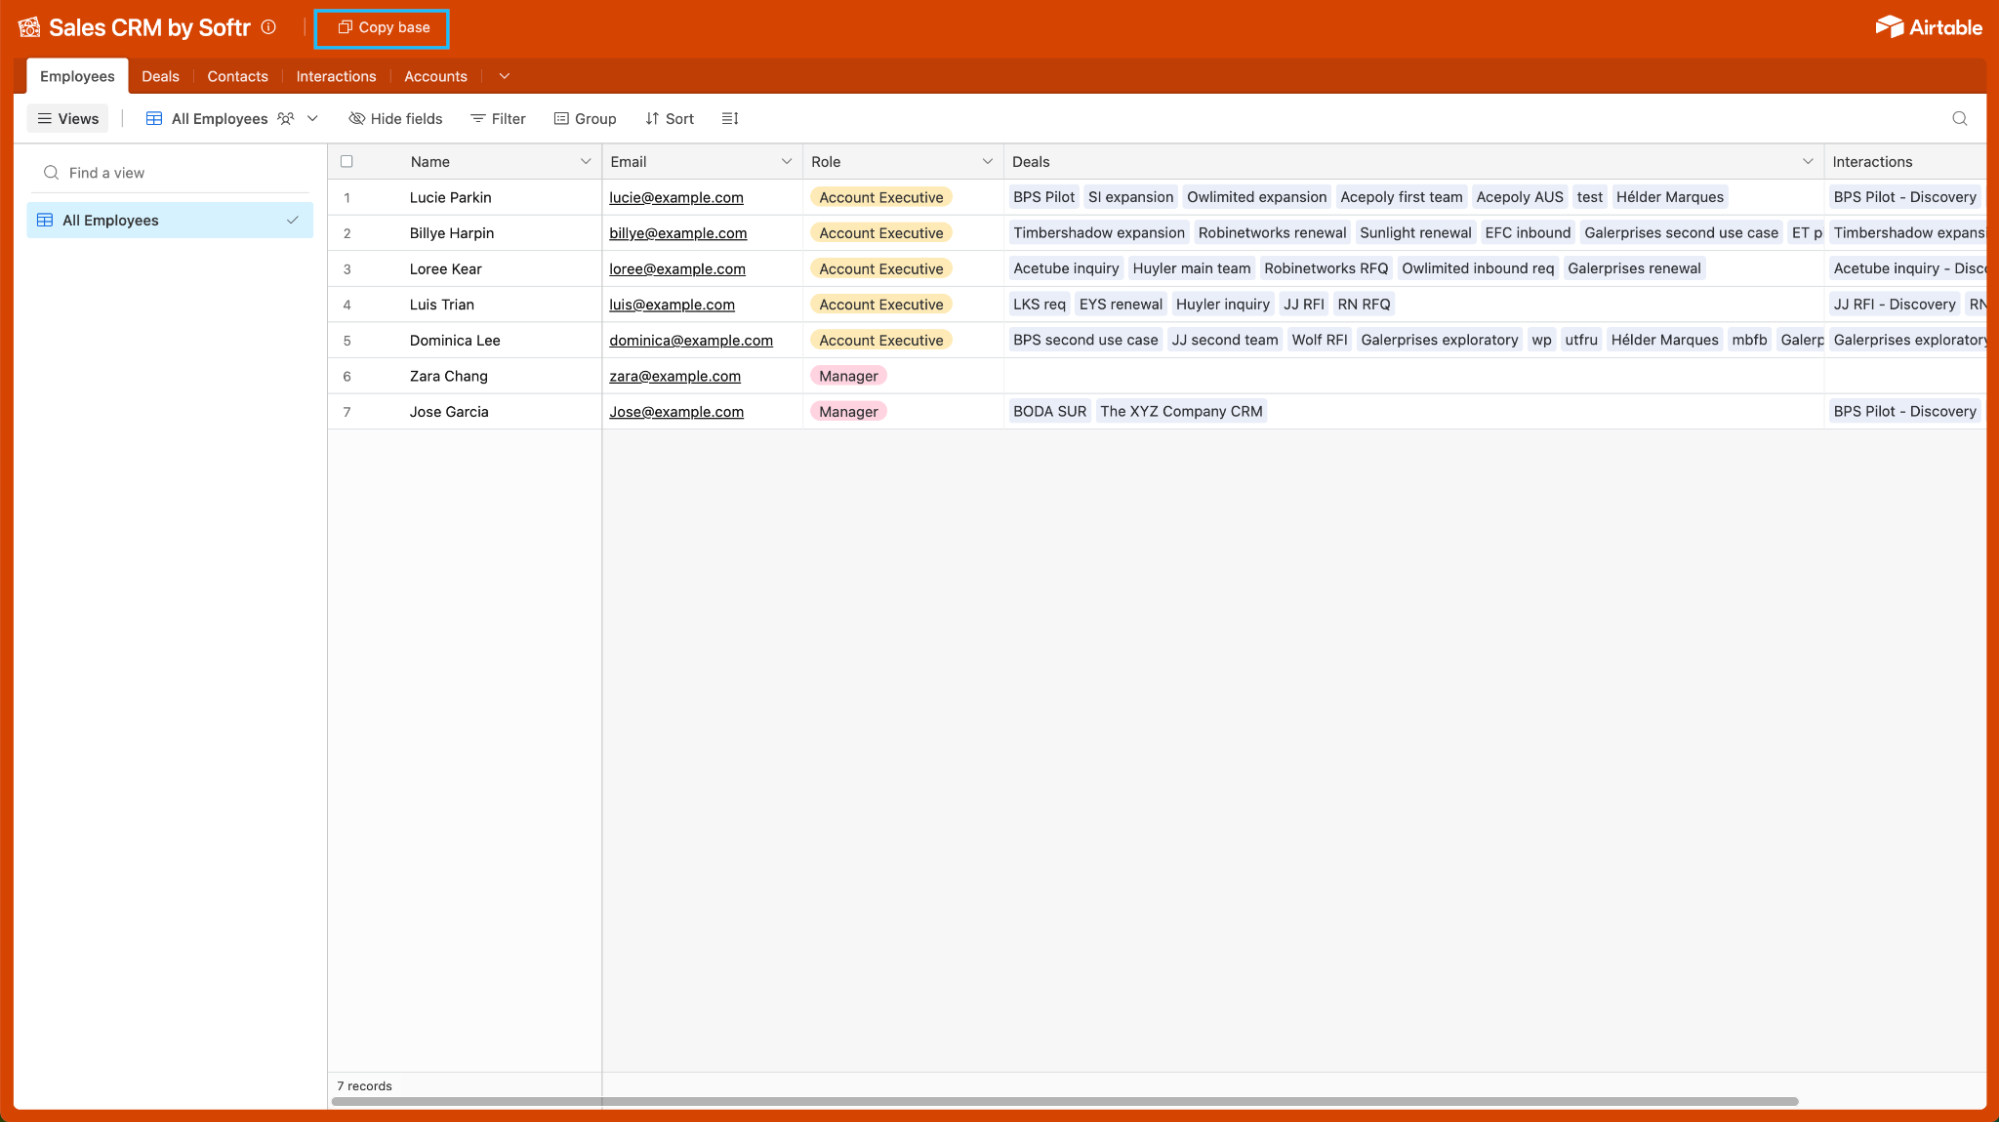
Softr’s Sales CRM Template.
Step 2: Go to “Interfaces”
On the top of the page, next to the base name, you will have three options: “Data,” “Automations,” and “Interfaces.” Click on the latter.
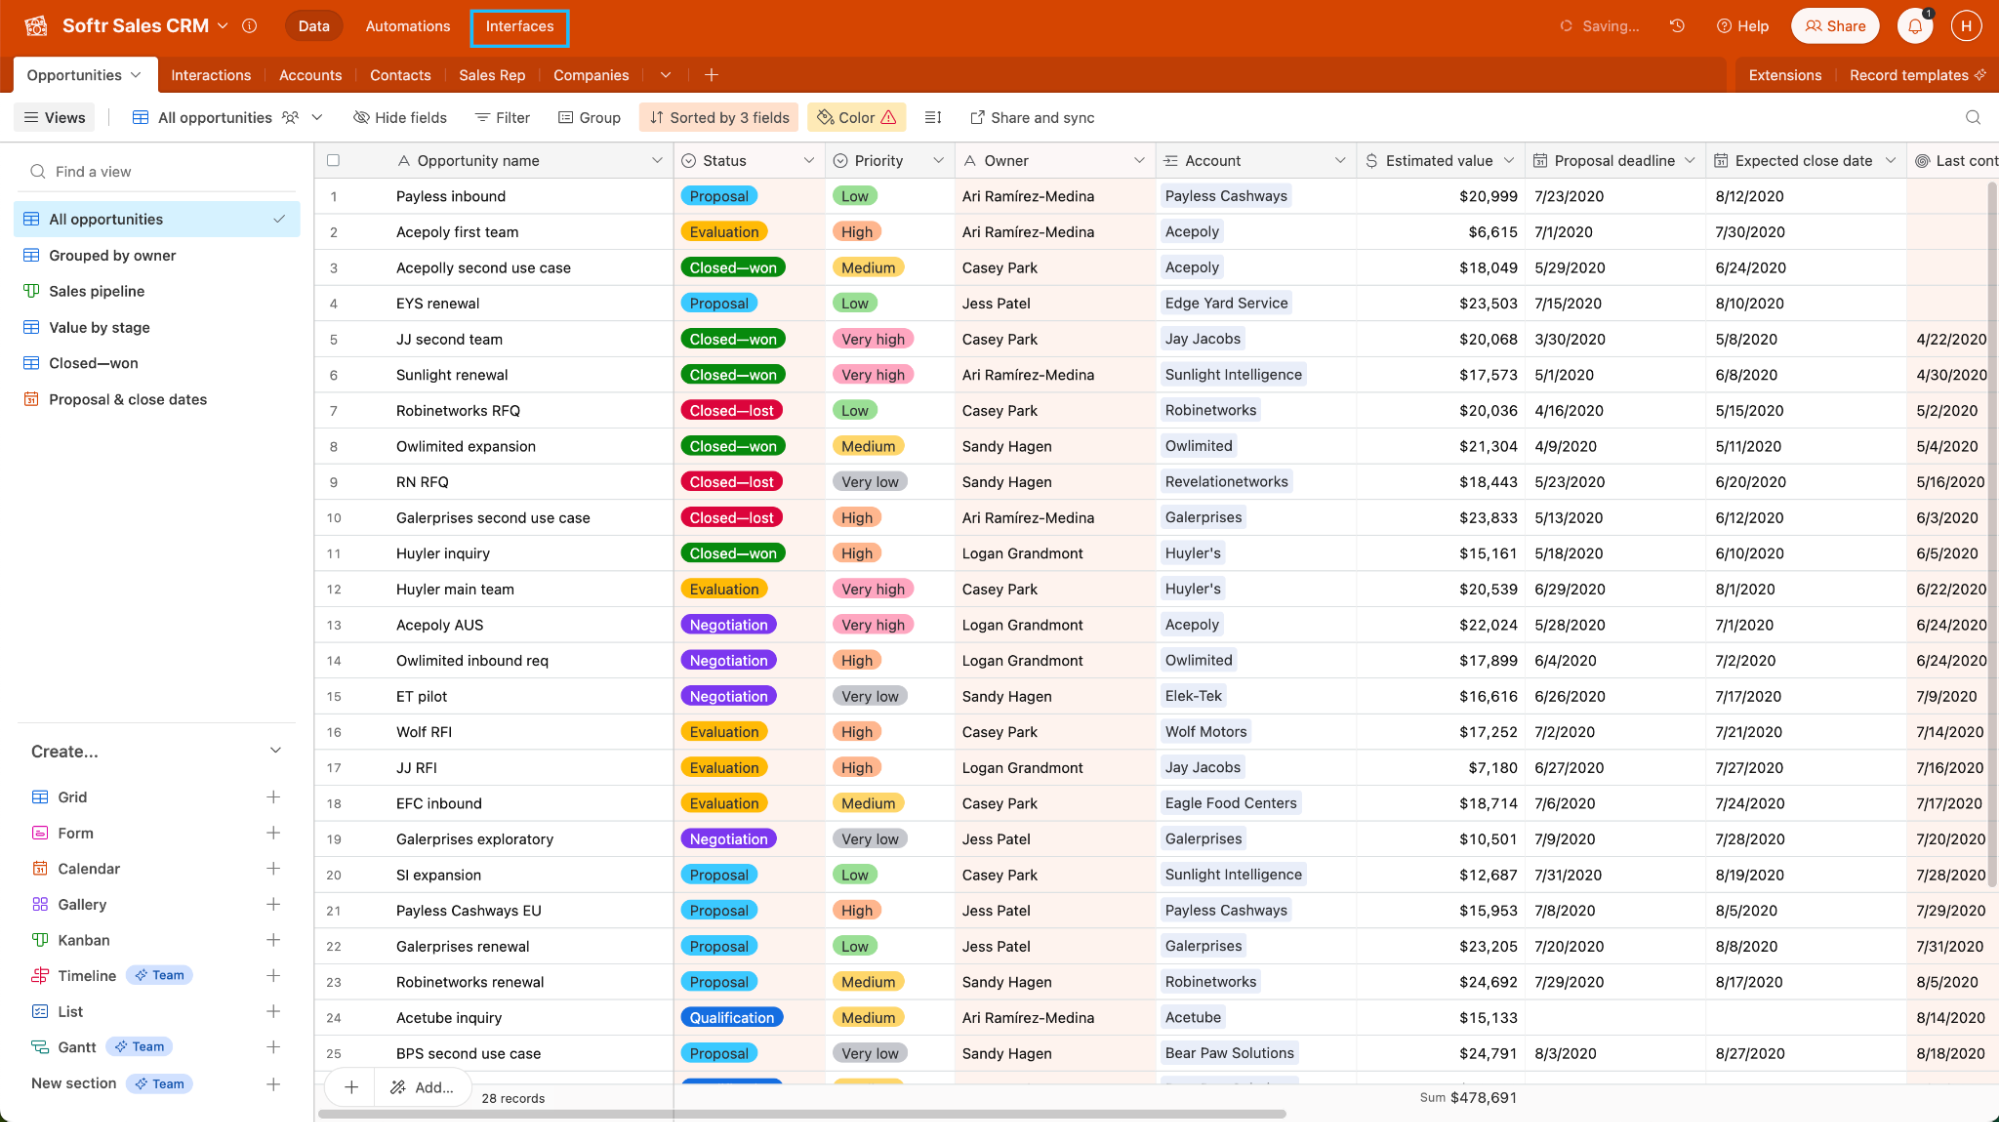
Airtable base view.
Step 3: Click on “Start building”
As we are building our first interface page, an informative page will appear. There, you should click on “Start building” to start creating your dashboard.
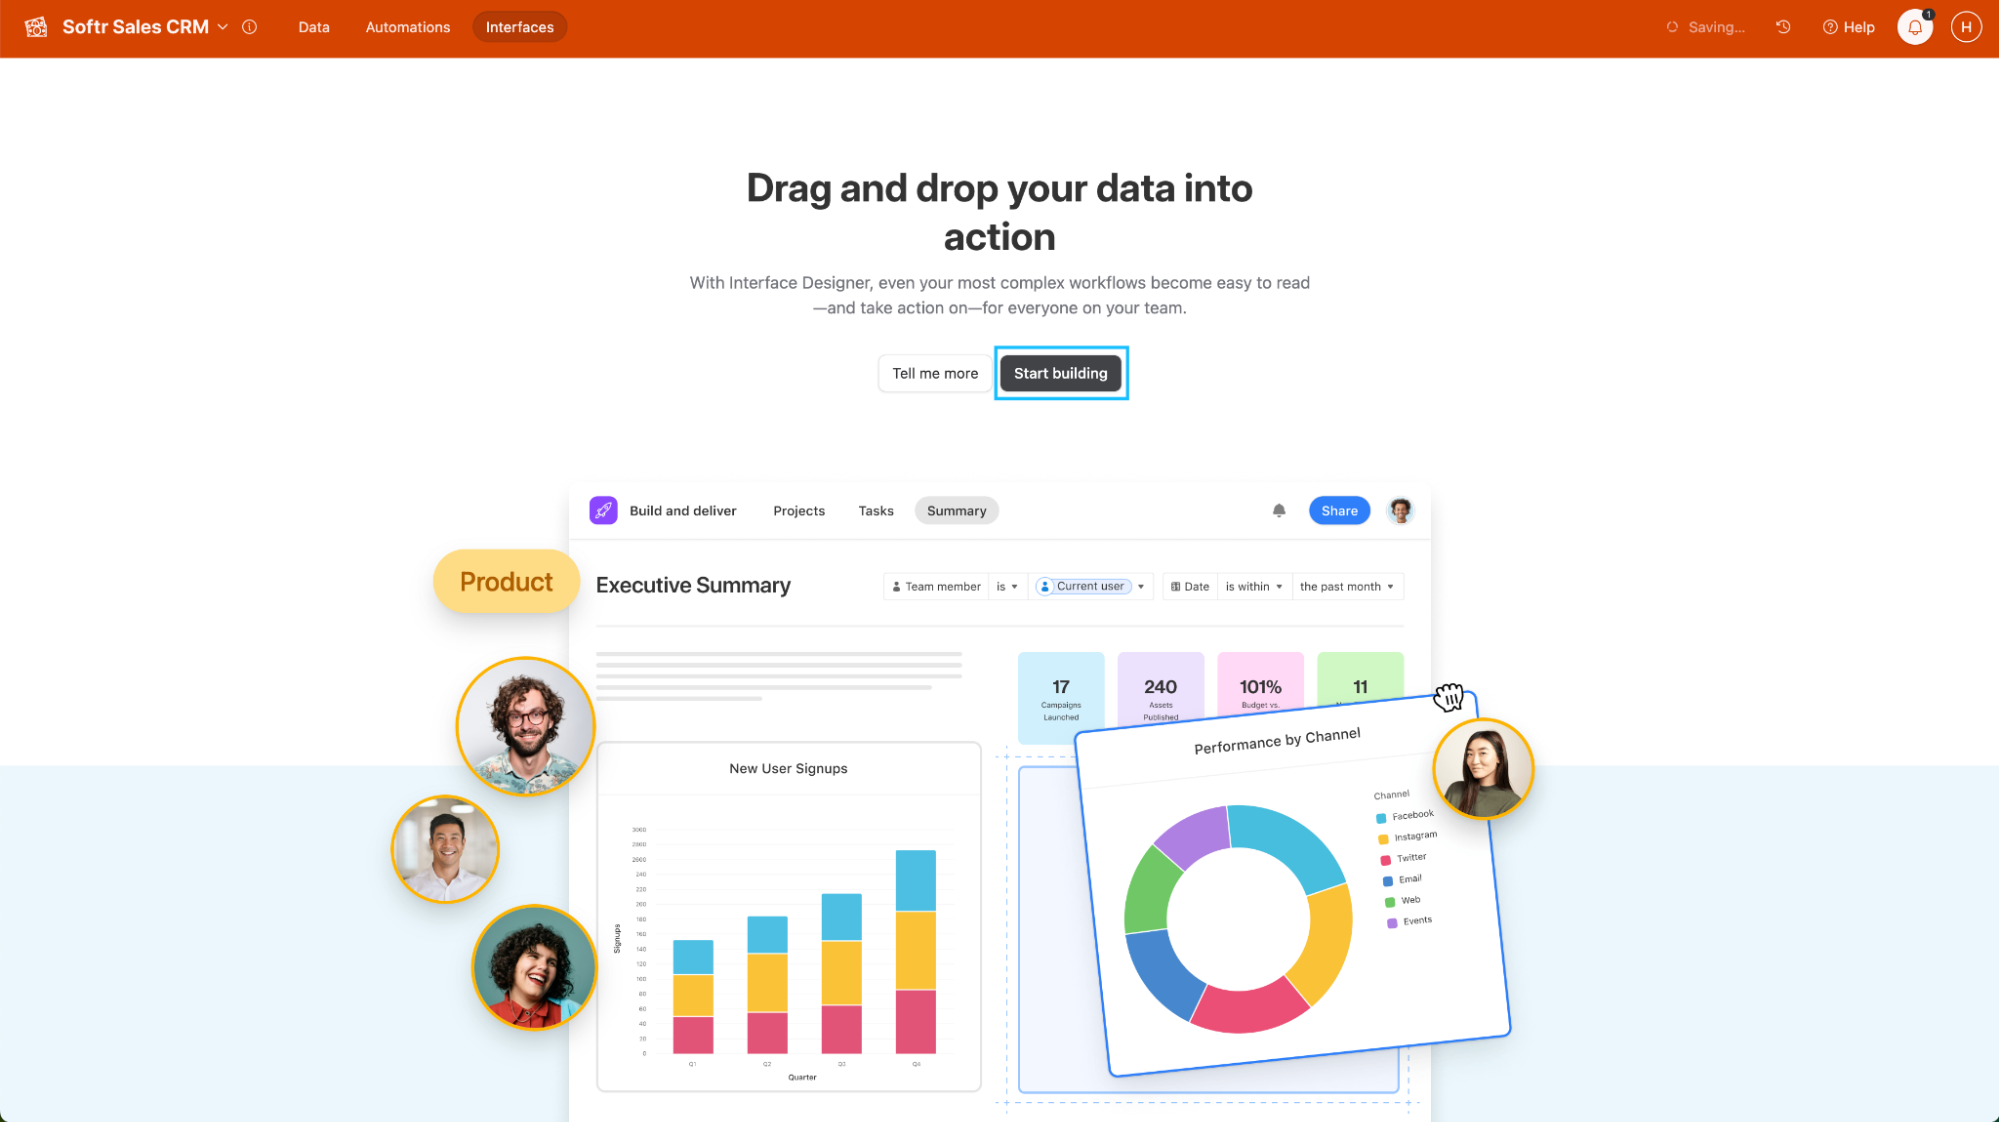
Airtable Interface Designer’s introductory page.
Step 4: Create your dashboard
Now that you have a database and accessed Airtable Interface Designer, follow the next steps to create a dashboard.
Step 4.1: Name your dashboard
Airtable will prompt a popup for you to choose a name and an icon for your interface, which will be your dashboard. In this guide, I’ll name it “My Dashboard.” You may choose the icon that you like.
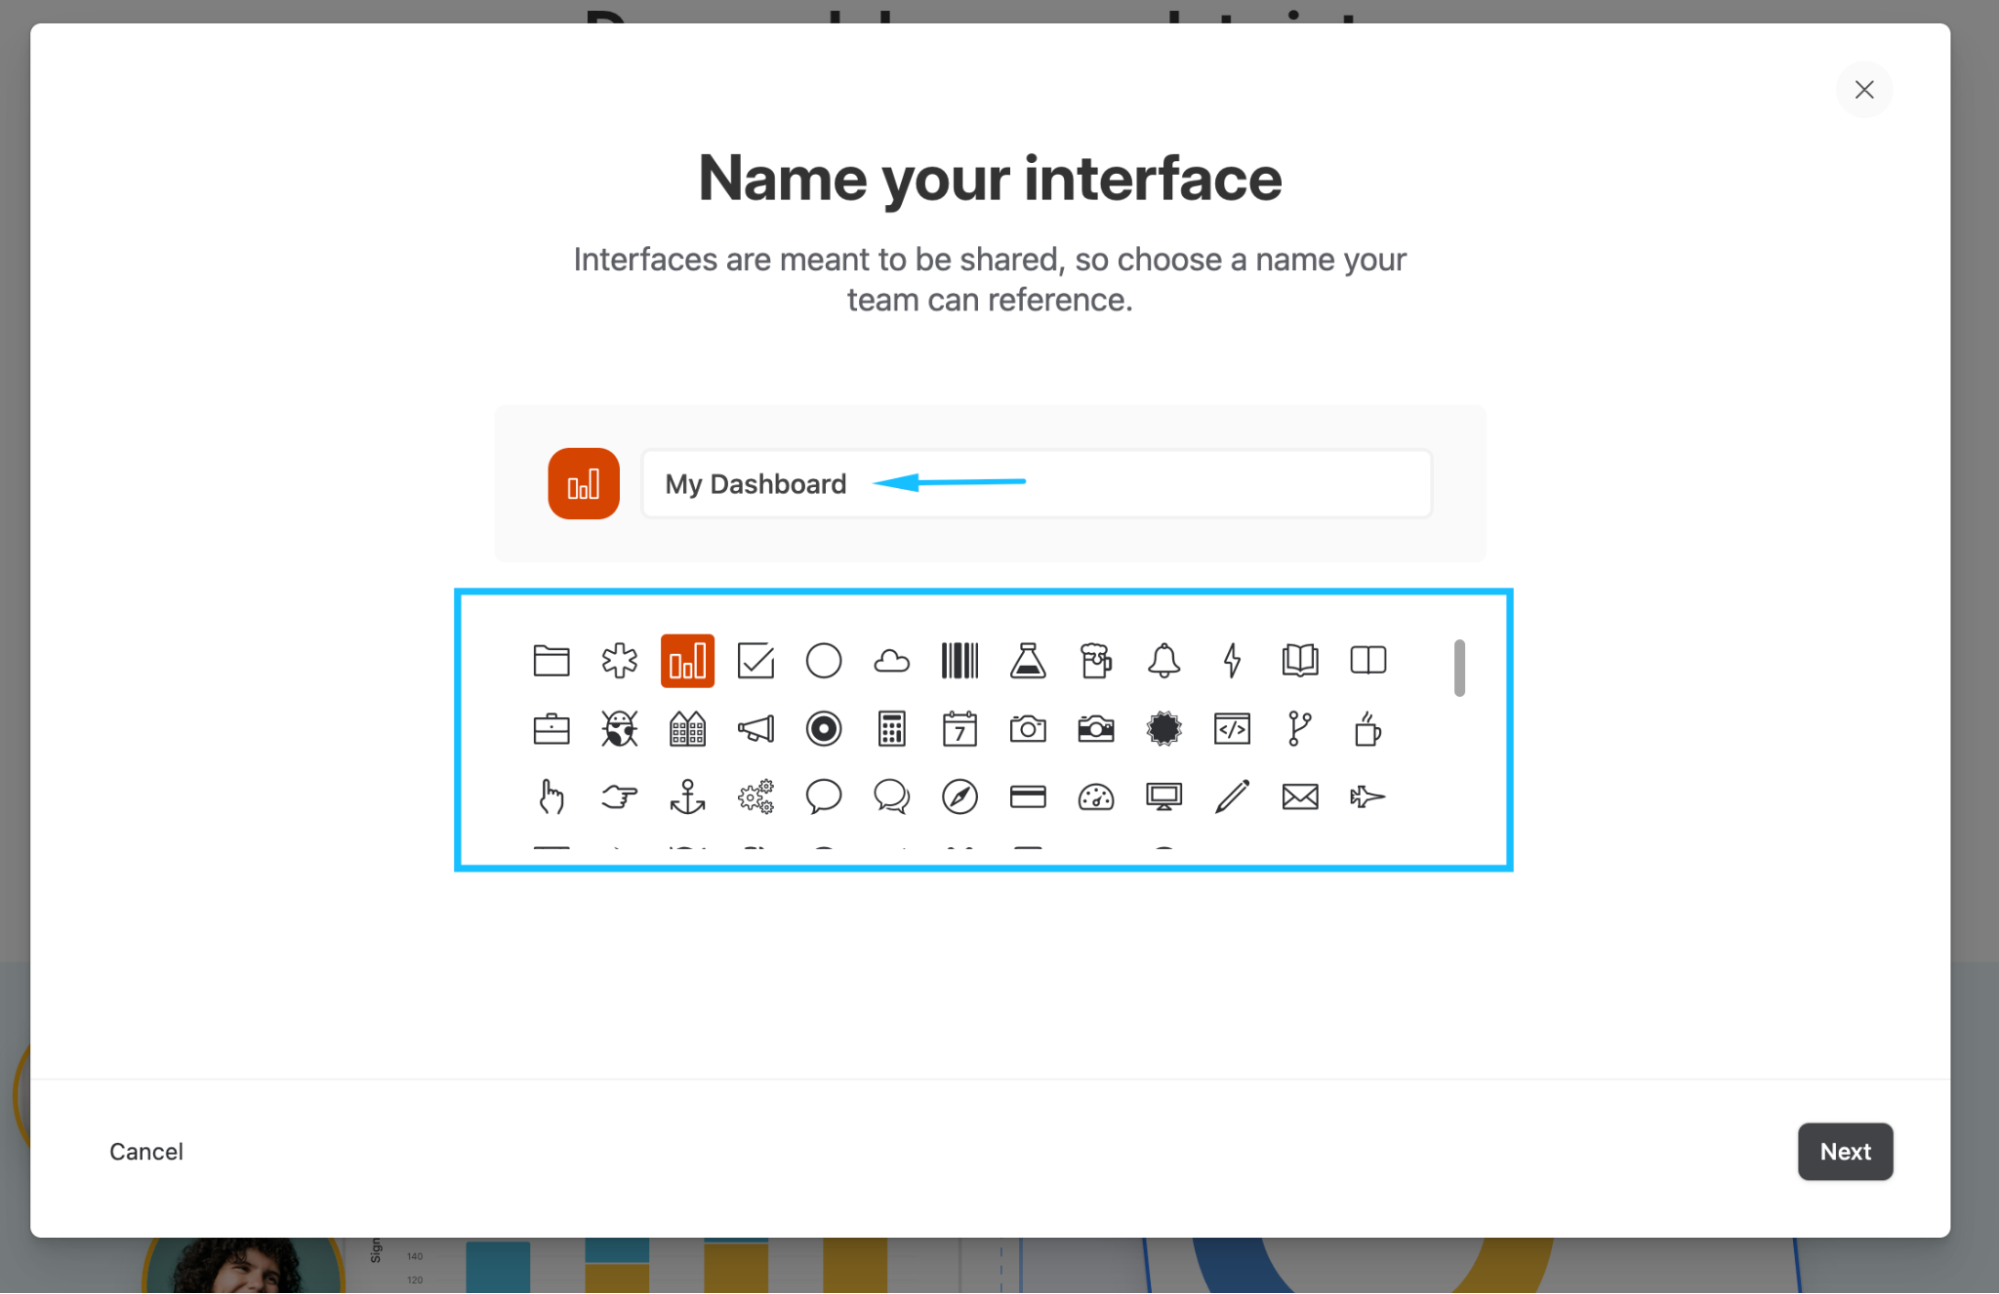
Naming a new interface in Airtable Interface Designer.
Step 4.2: Choose a layout
Airtable has a comprehensive list of pre-built layouts with corresponding blocks to summarize and aggregate your Airtable data. Depending on what you want to display you may choose different options, such as “Kanban,” “Timeline,” “Dashboard,” or “Record review.”
If you want to create a dashboard, choose the Dashboard layout and click on “Next.”
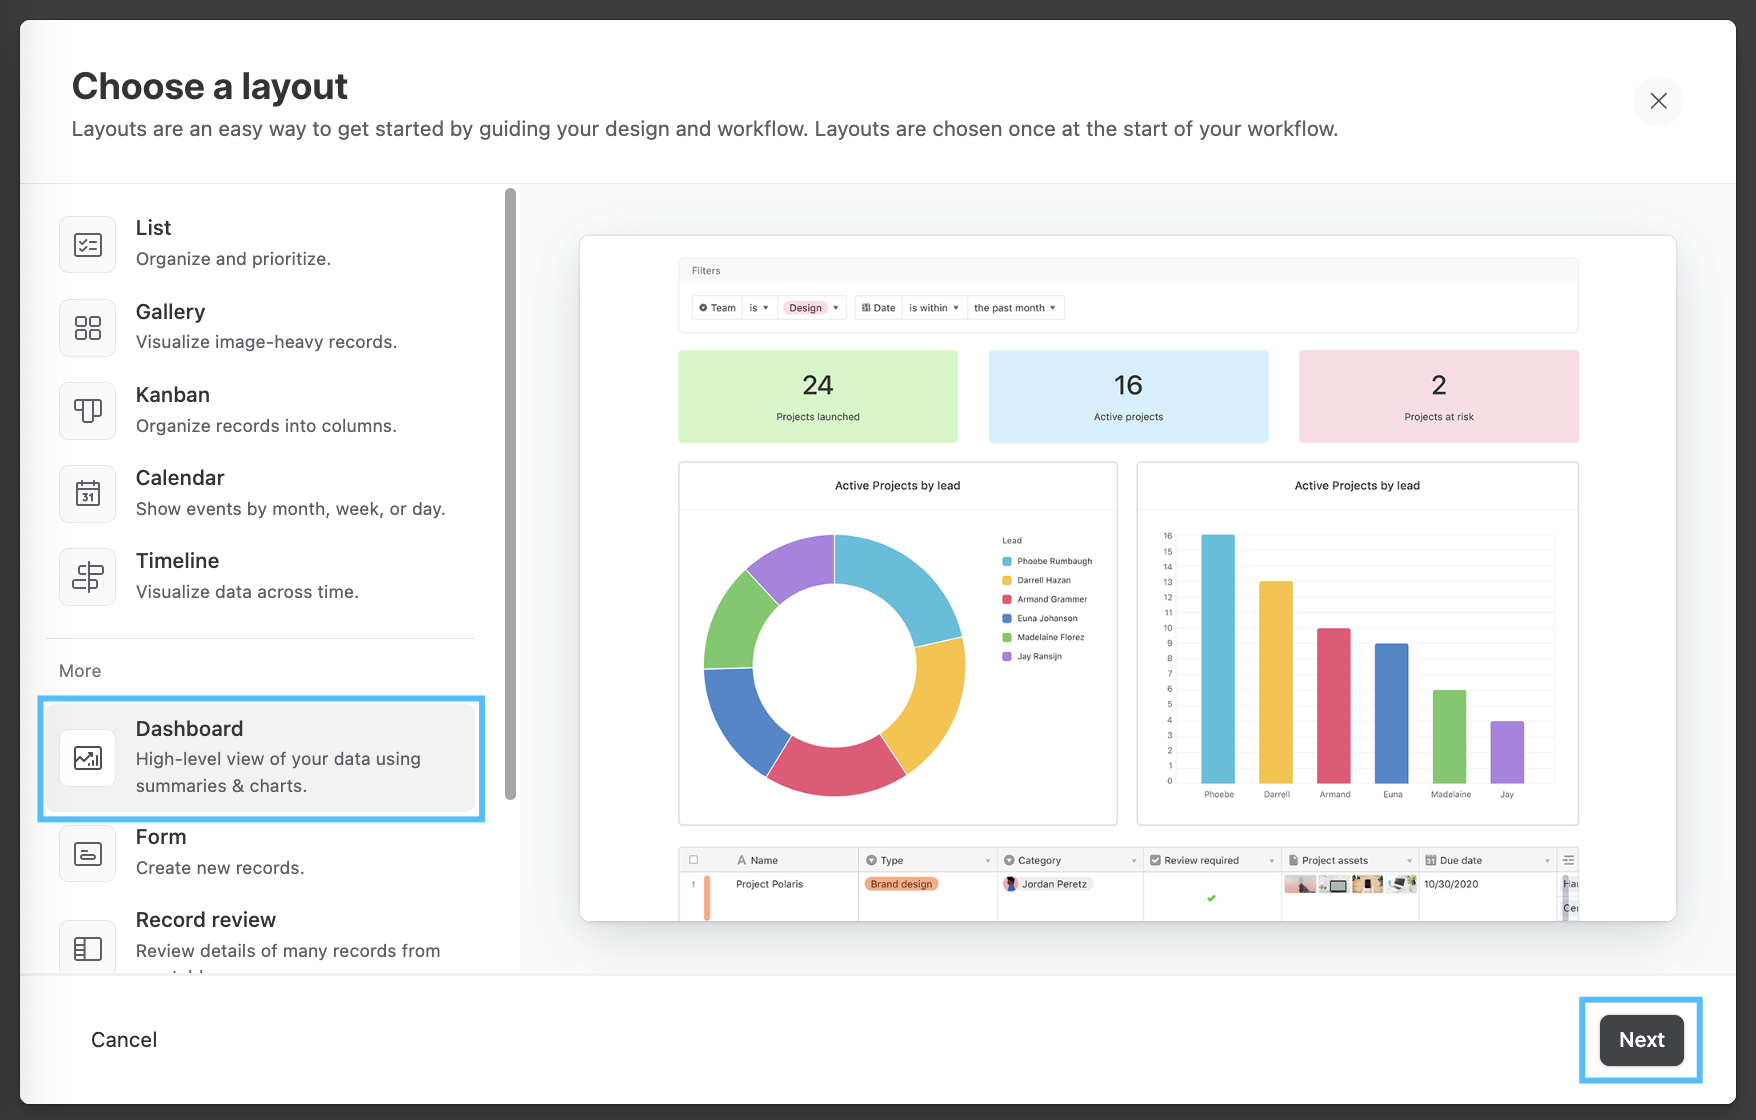
Choosing a layout in Airtable Interface Designer.
Step 4.3: Connect to a table
You are almost done with this initial set-up. Just choose the table where your data is and click “Next.”
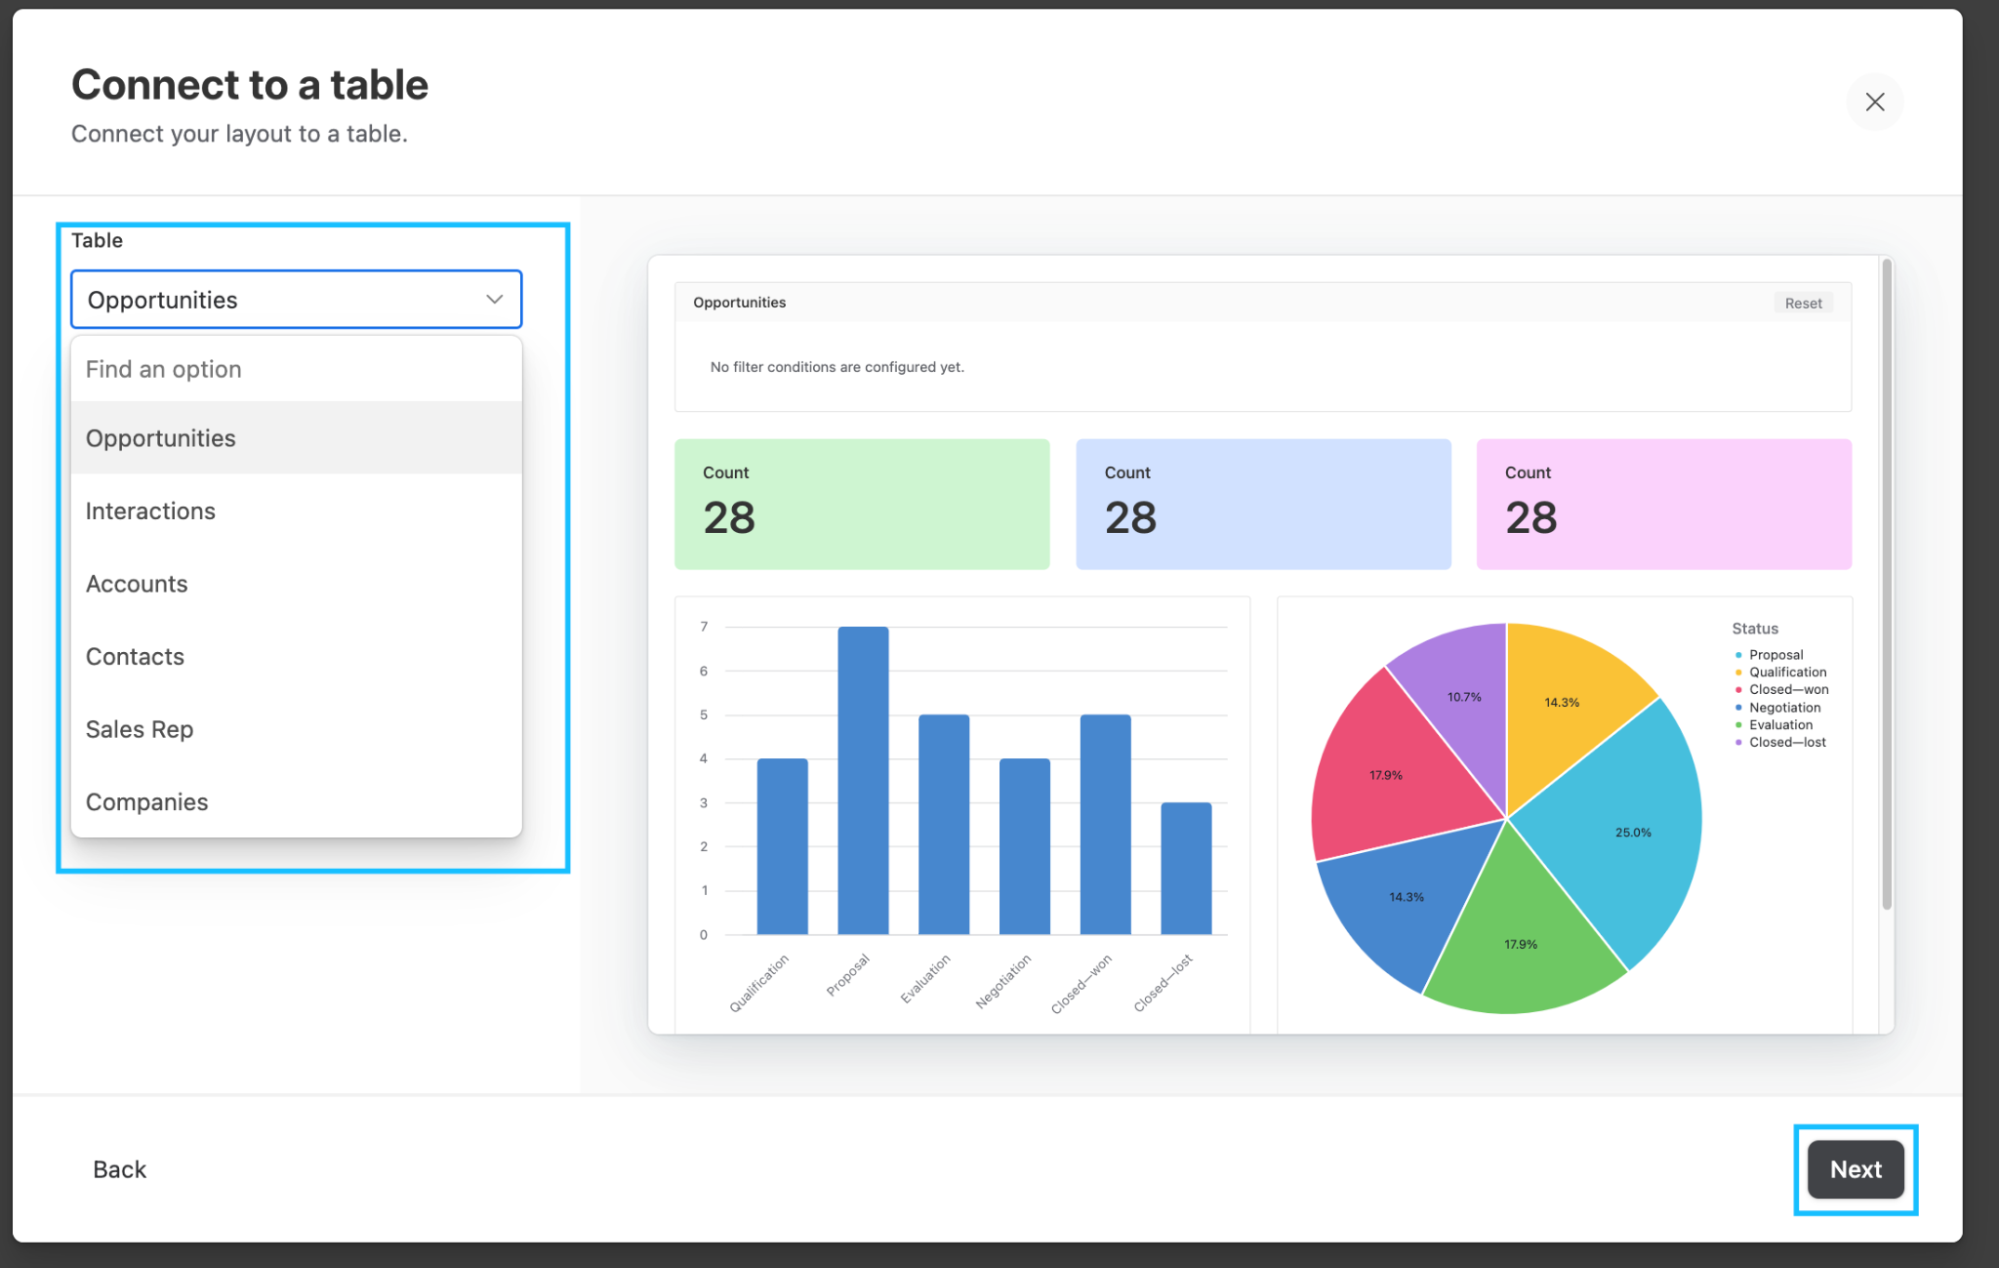
Connecting the interface layout to a table in Airtable Interface Designer.
Step 4.4: Complete the initial configuration
The last steps in creating a dashboard are adding and editing elements to its first page and naming it. I strongly recommend you skip the first of these steps because you will have more options to edit these elements later.
You just need to click “Next,” name your dashboard page and click on “Finish.”
Step 5: Add elements
To add a new element to your dashboard, click on the “+ Add element” button on the bottom-left side of the window, choose the element you want to add and place it in the place you want it to be.
Adding elements to a dashboard in Airtable Interface Designer.
Step 6: Personalize your dashboard’s elements
Once you click on an element, the sidebar on the right will provide you with options to define the data settings and the appearance of that specific element. Here are some examples of how you can personalize the elements in your dashboard.
Step 6.1: Add filters
The top element on your dashboard functions as a filter. This filter allows you to select the data that will be used by all other elements on your dashboard. In other words, the other elements will aggregate and calculate data based on the filtered criteria you set.
After clicking on this element find the option “Filter,” under the section “Data” on the right-side bar. Once you click on it, you can define what conditions you want.
Adding filters to a dashboard in Airtable Interface Designer.
Step 6.2: Change elements’ appearance
You can easily change colors, titles and descriptions of your dashboard’s elements, by clicking on the “Appearance” tab on the right sidebar.
Changing elements' appearance in Airtable Interface Designer.
Step 6.3: Filter the data used by your dashboard’s elements
On the “Data” tab, you can choose to either include all records from your table or specify which records to include by setting conditions. Click on “Specific records” in the “Records” section, and configure the conditions that are relevant to the element you are editing.
Filtering elements’ data in Airtable Interface Designer.
Step 6.4: Change fields and values used by your dashboard’s elements
Depending on the element you are using, you may find a variety of options related to fields, values, axis or data. Explore these options according to the elements you are using in your dashboard.
In my example, I edited a pie chart to display the sum of the estimated value of each opportunity status. The video below illustrates how you can change the category used and the value considered for each slice of the chart.
Changing fields and values in Airtable Interface Designer.
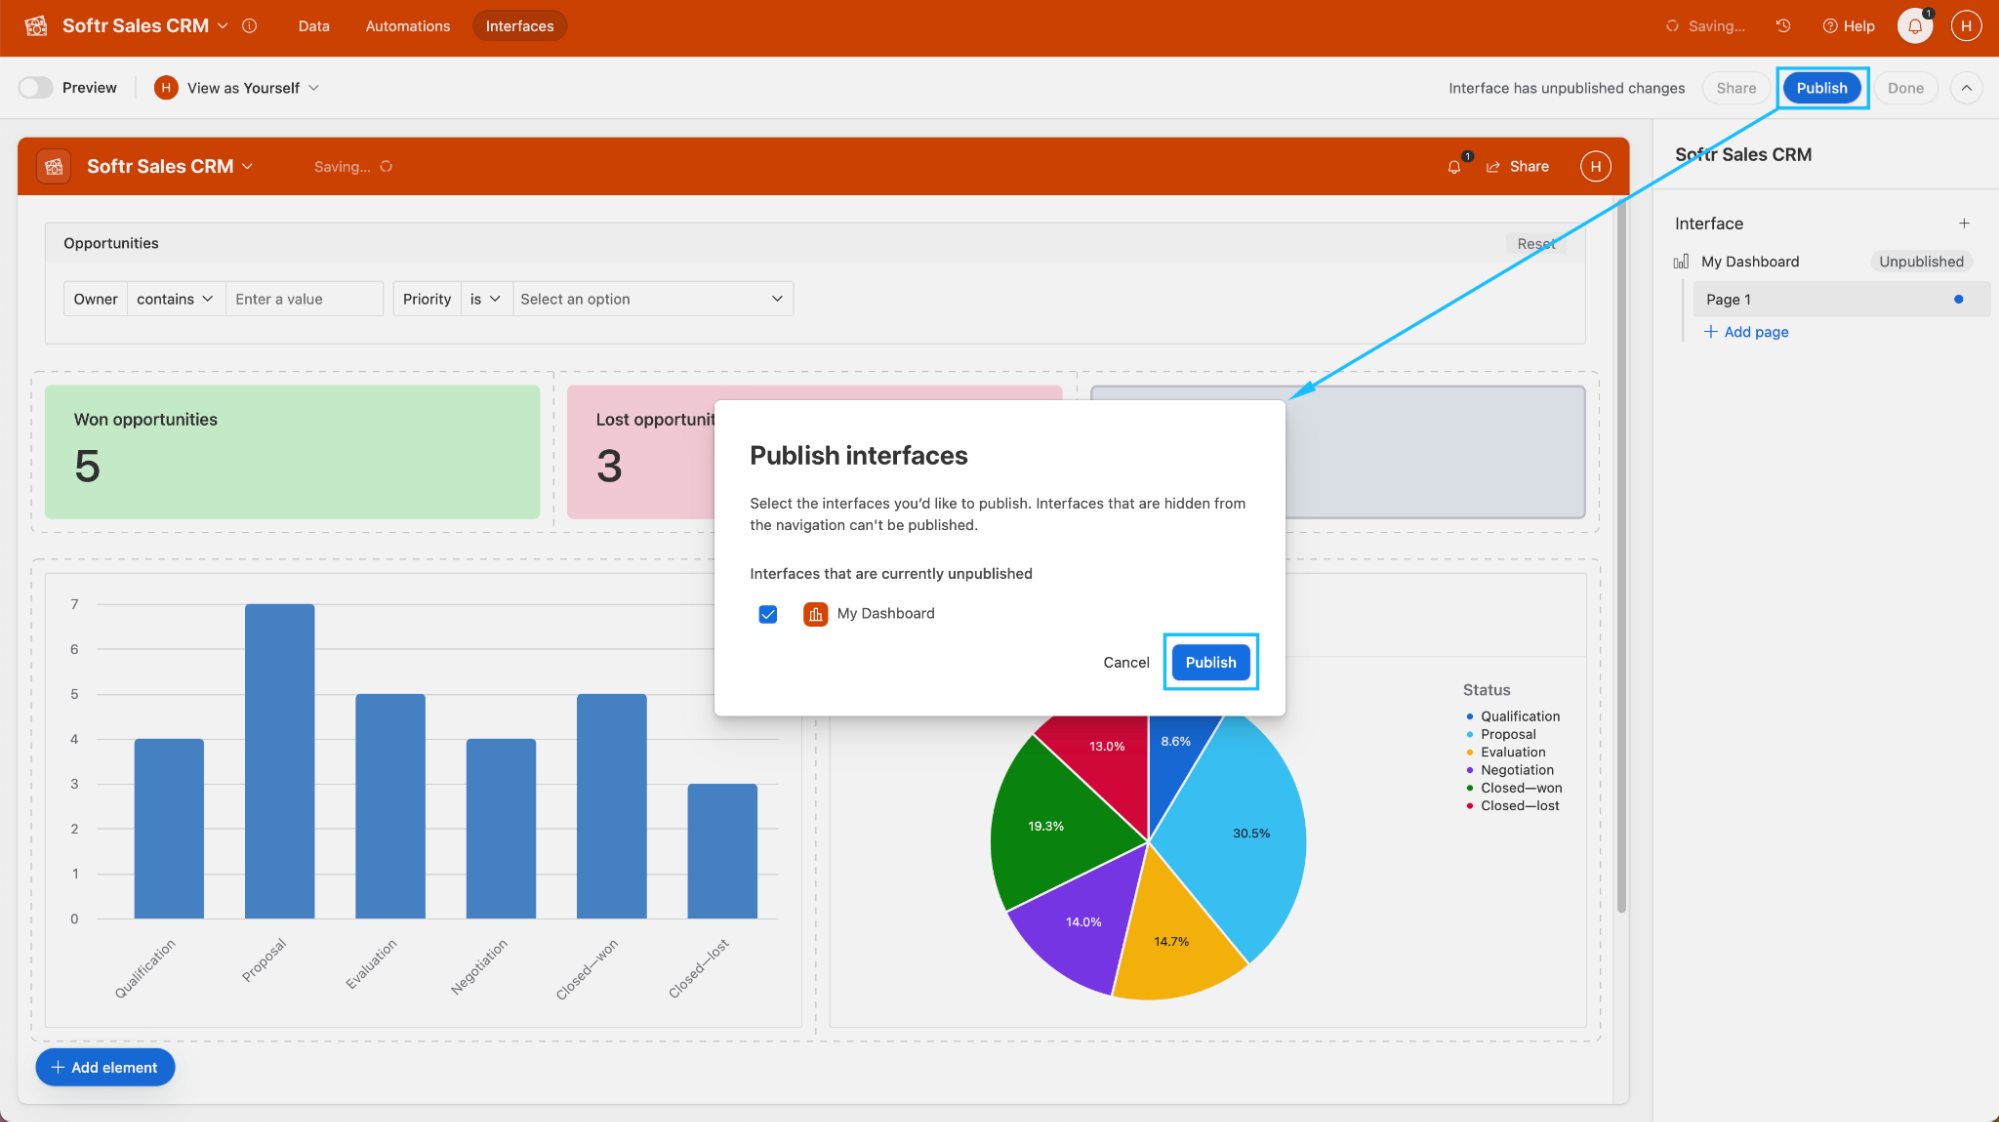
Step 6: Publish and share your dashboard
Once you have finished personalizing your dashboard, you are ready to publish it and, eventually, share it with your team or stakeholders.
On the top-right of the window, click on “Publish” and confirm this action on the popup.
Creating dashboards with Softr and Airtable
Softr takes dashboard creation to the next level, offering enhanced customization options and seamless integration with Airtable. In this section, we'll explore how to harness the power of Softr to build dynamic and feature-rich dashboards that elevate your data visualization game.
Step 1: Sign in or register to Softr
First, you will need to log in to Softr. If you don’t have an account, you can sign up to Softr for free.

Softr’s homepage
Step 2: Click on “New Application”
With your Softr account set up, it's time to create a new application where your content calendar will be housed.
On your Softr dashboard, locate and click on the "New Application" button.

Templates section of Softr Studio.
Step 3: Search for an adequate template
Softr offers a variety of templates you can use or adjust to achieve the dashboard you need. In this guide, I will be using the SaaS Dashboard Template. To find it, use the search bar to search for “SaaS dashboard.” Then click on the template with that name.
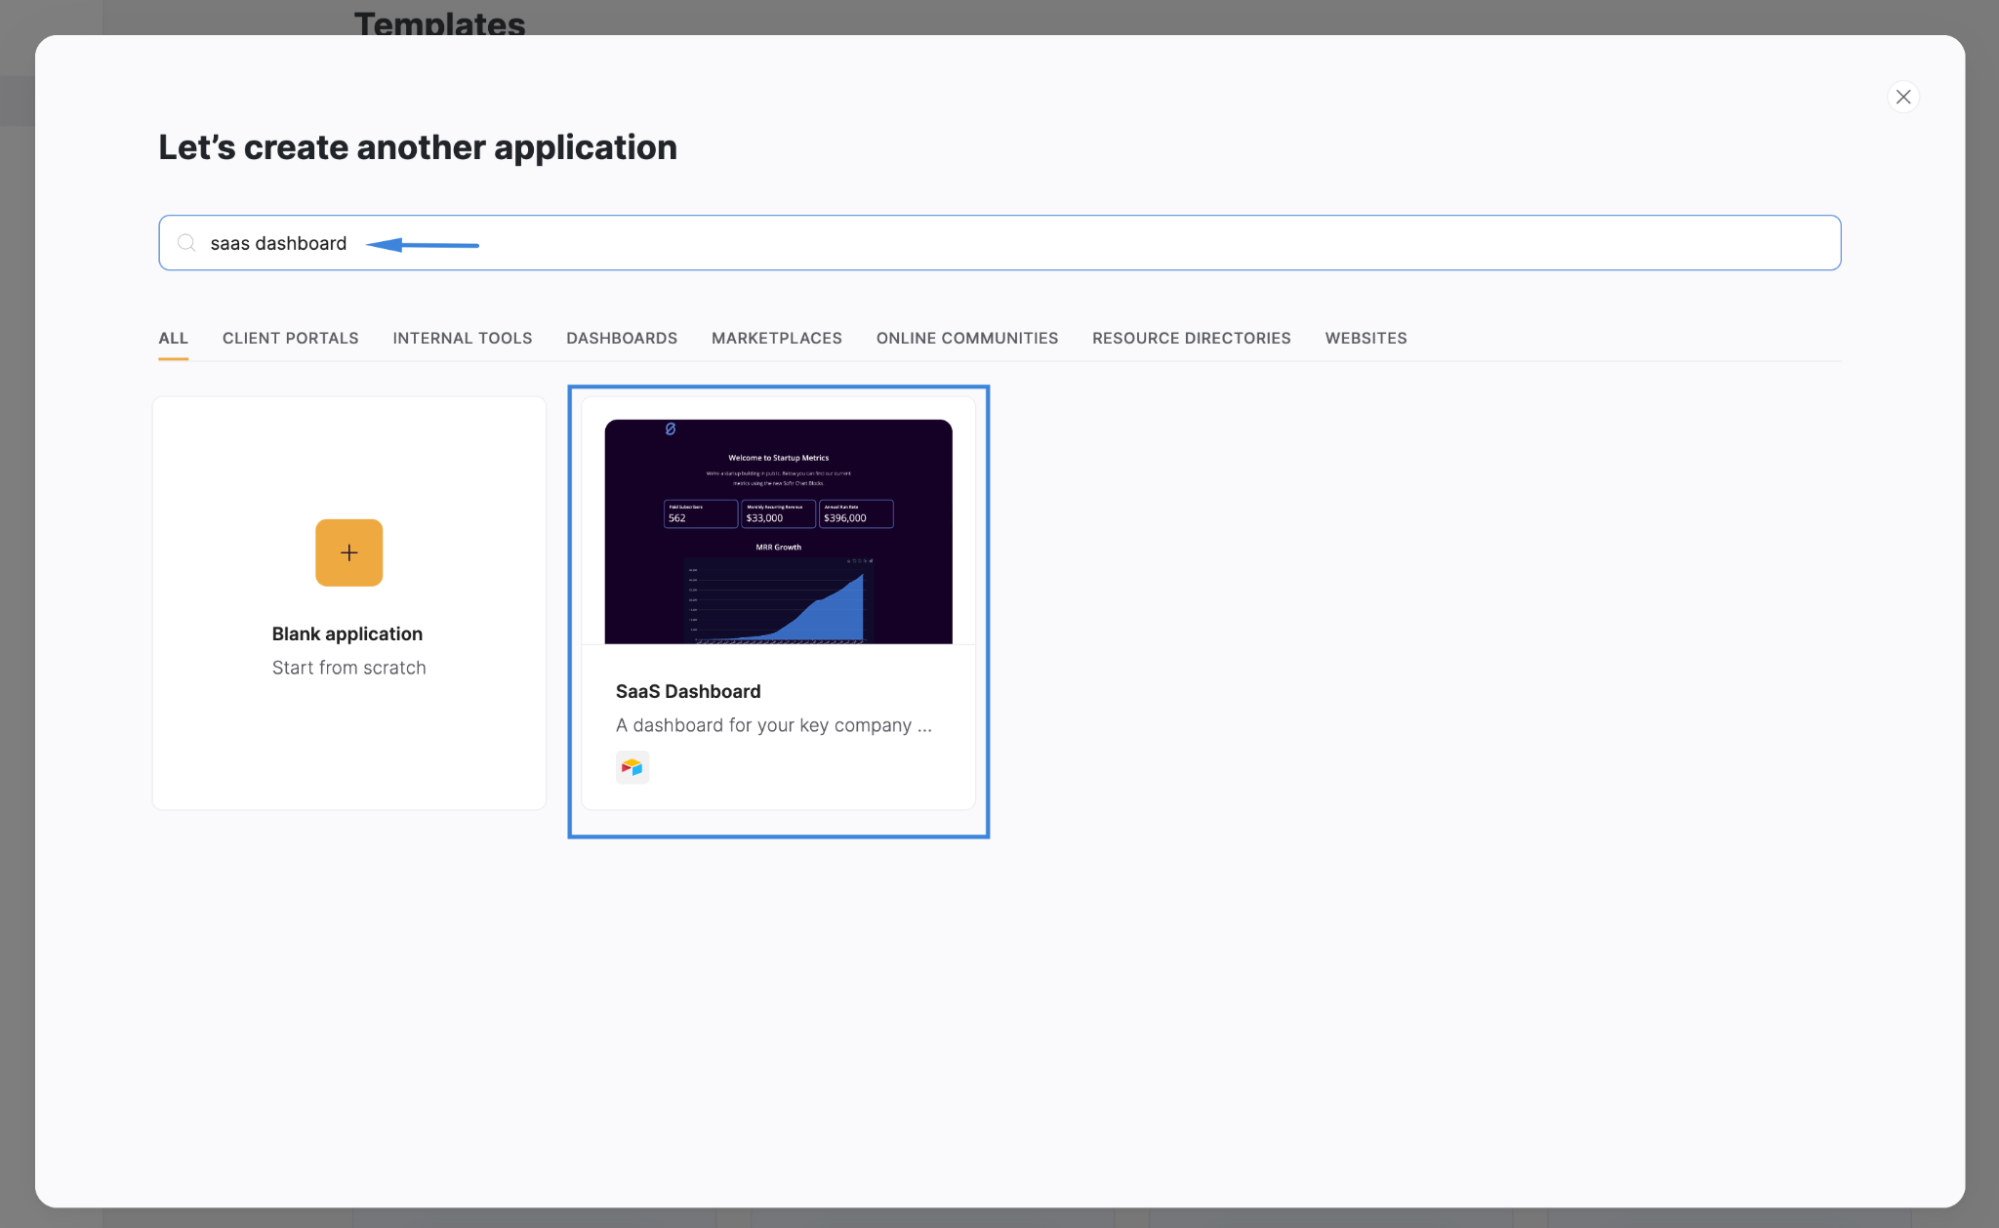
Softr Studio’s filtered template list.
Step 4: Click on “Use Template”
You can now learn more about the template, including its features and functionalities. Once you’re ready, click on the “Use Template” button.
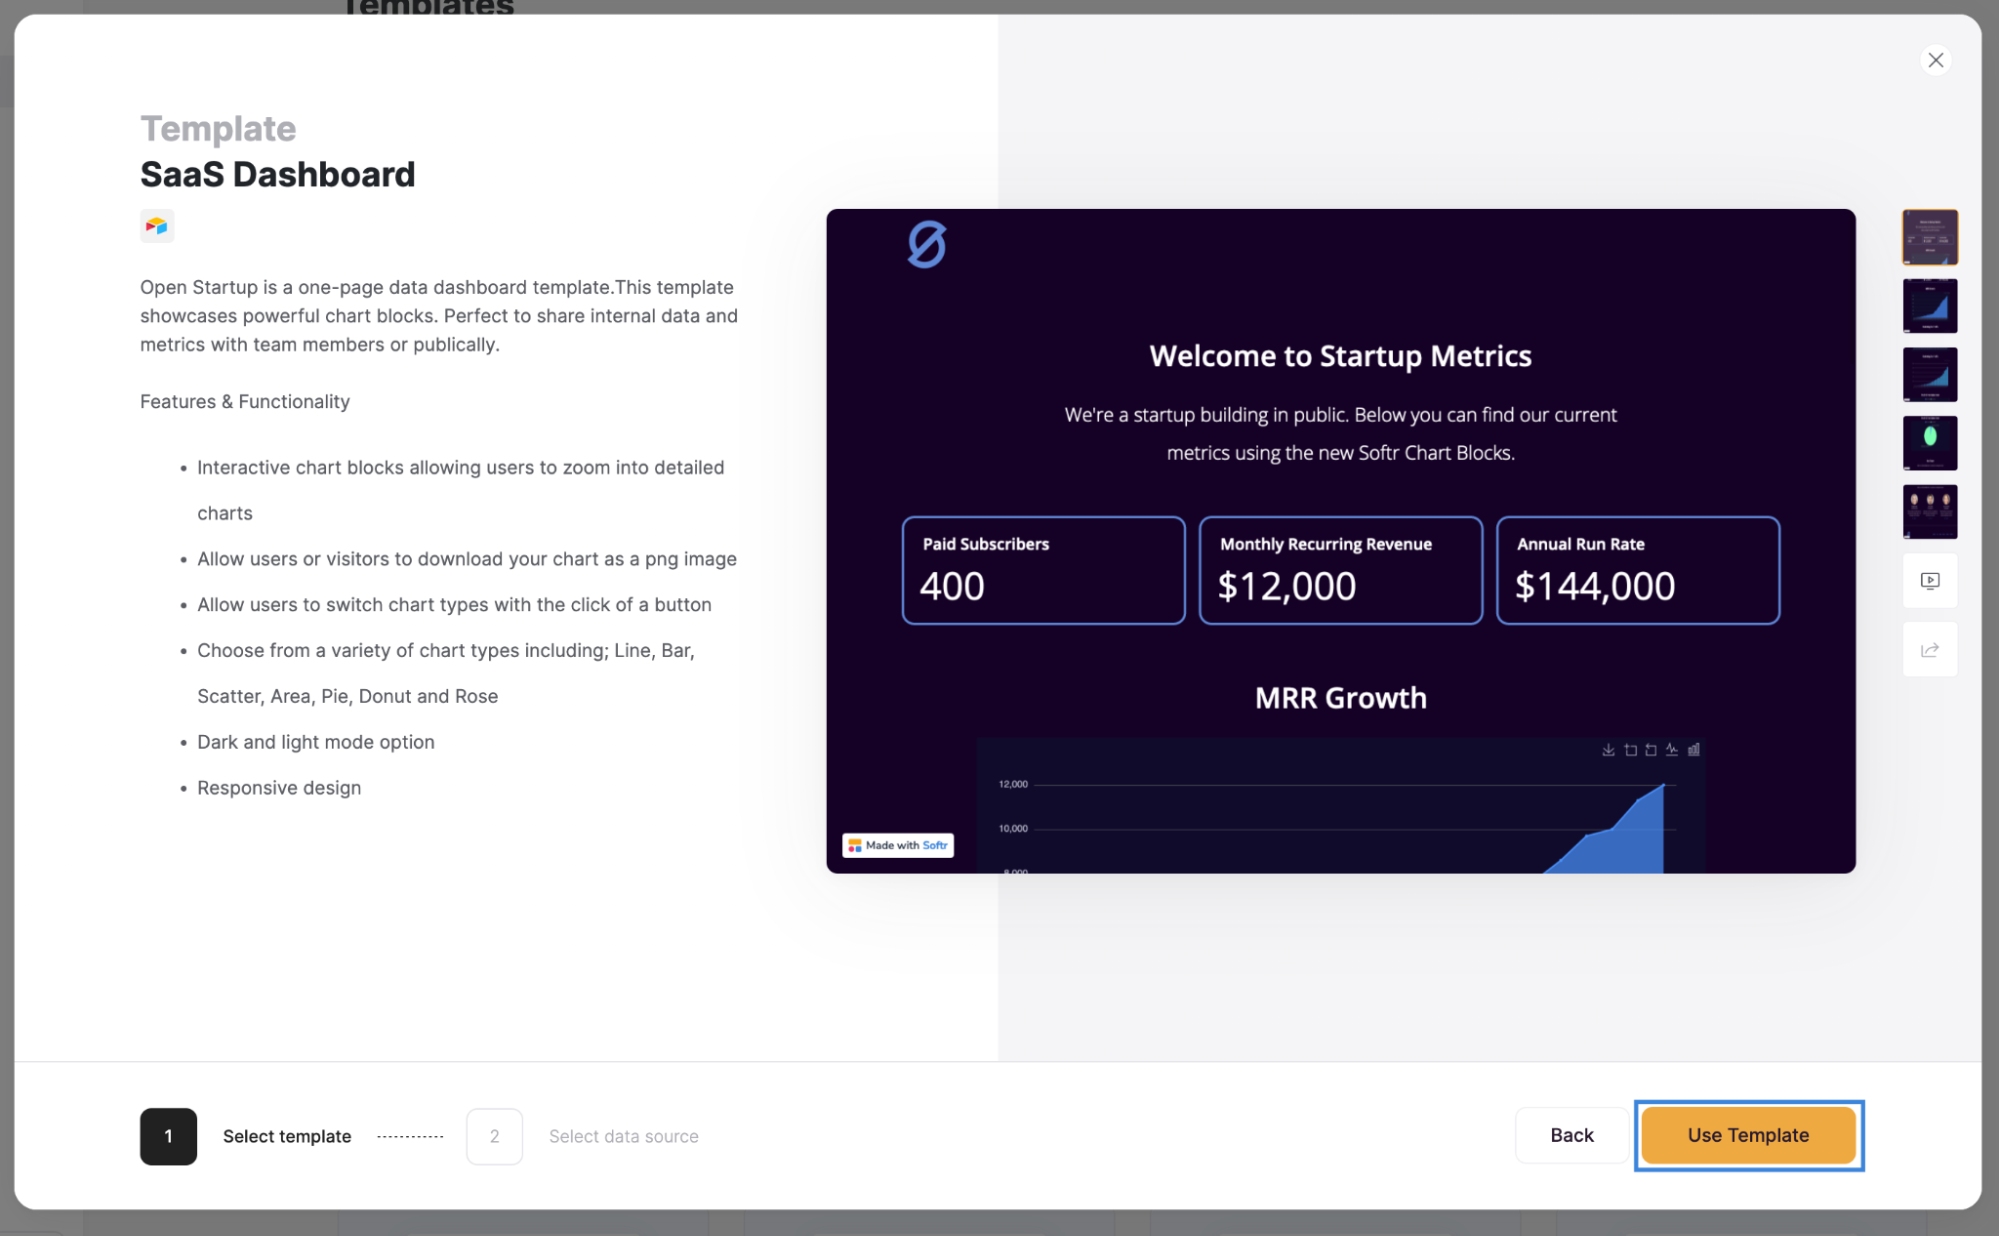
Softr template preview.
Step 5: Select Airtable as your data source
Next, you will need to choose Airtable as your data source and click “Continue.”
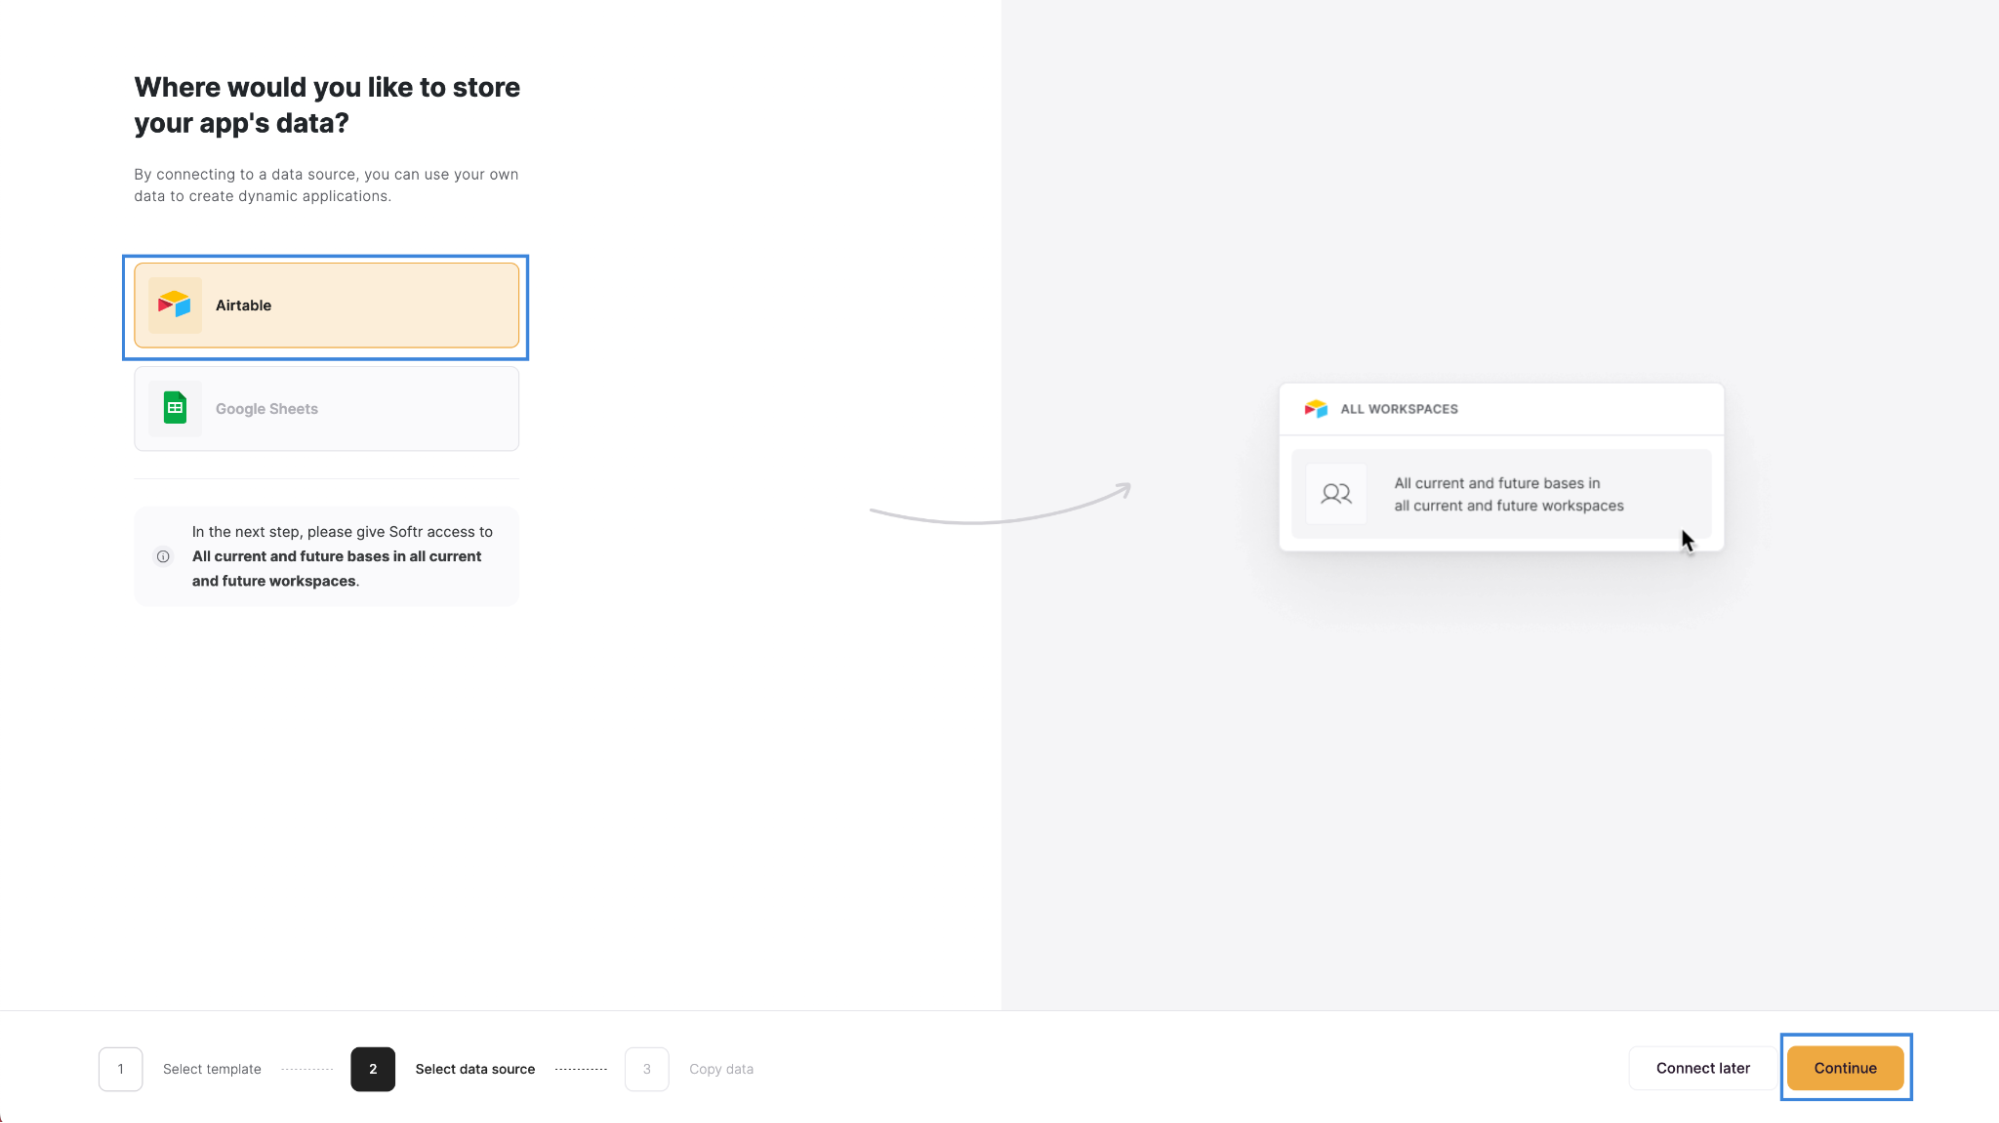
Step 6: Connect to Airtable
Now, a new tab or window will open for you to grant Softr access to your bases on Airtable.
Click on “Add base” and choose “All current and future bases in all current and future workspaces.” When you’re done, click on the “Grant access” button.
Giving Softr access to Airtable.
Step 7: Copy the Softr template base to Airtable
In order to use Softr’s template base for Airtable, click on “Copy base to your Airtable account.”
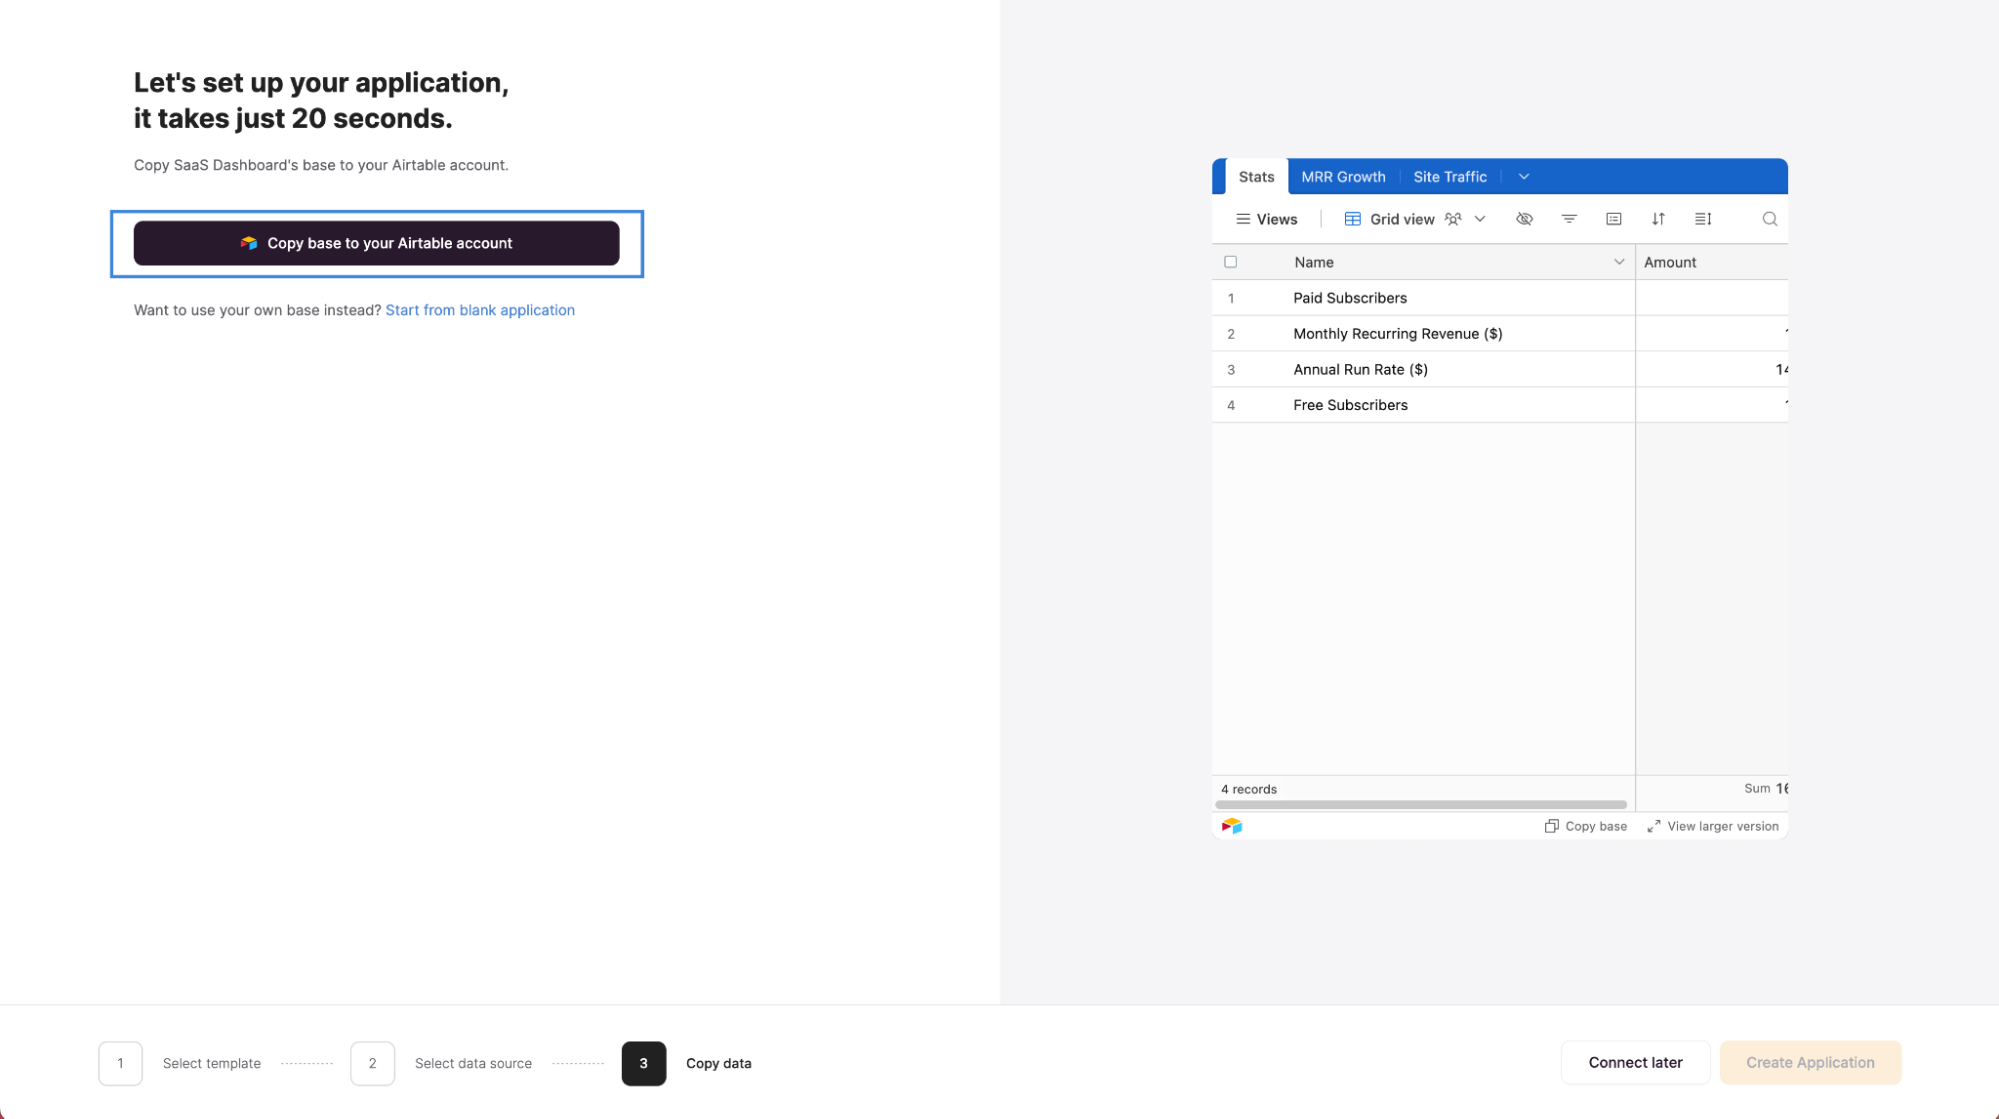
Copying an Airtable base from Softr to Airtable.
Step 8: Personalize your dashboard’s blocks
The basics are done! You now have a dashboard. Feel free to edit the content of your base and change the data shown and its design.
Step 8.1: Populate Airtable with your own data
Add or replace the data on the newly created “SaaS Dashboard by Softr” base in your Airtable’s workspace. Feel free to add more tables, fields or views if you need.
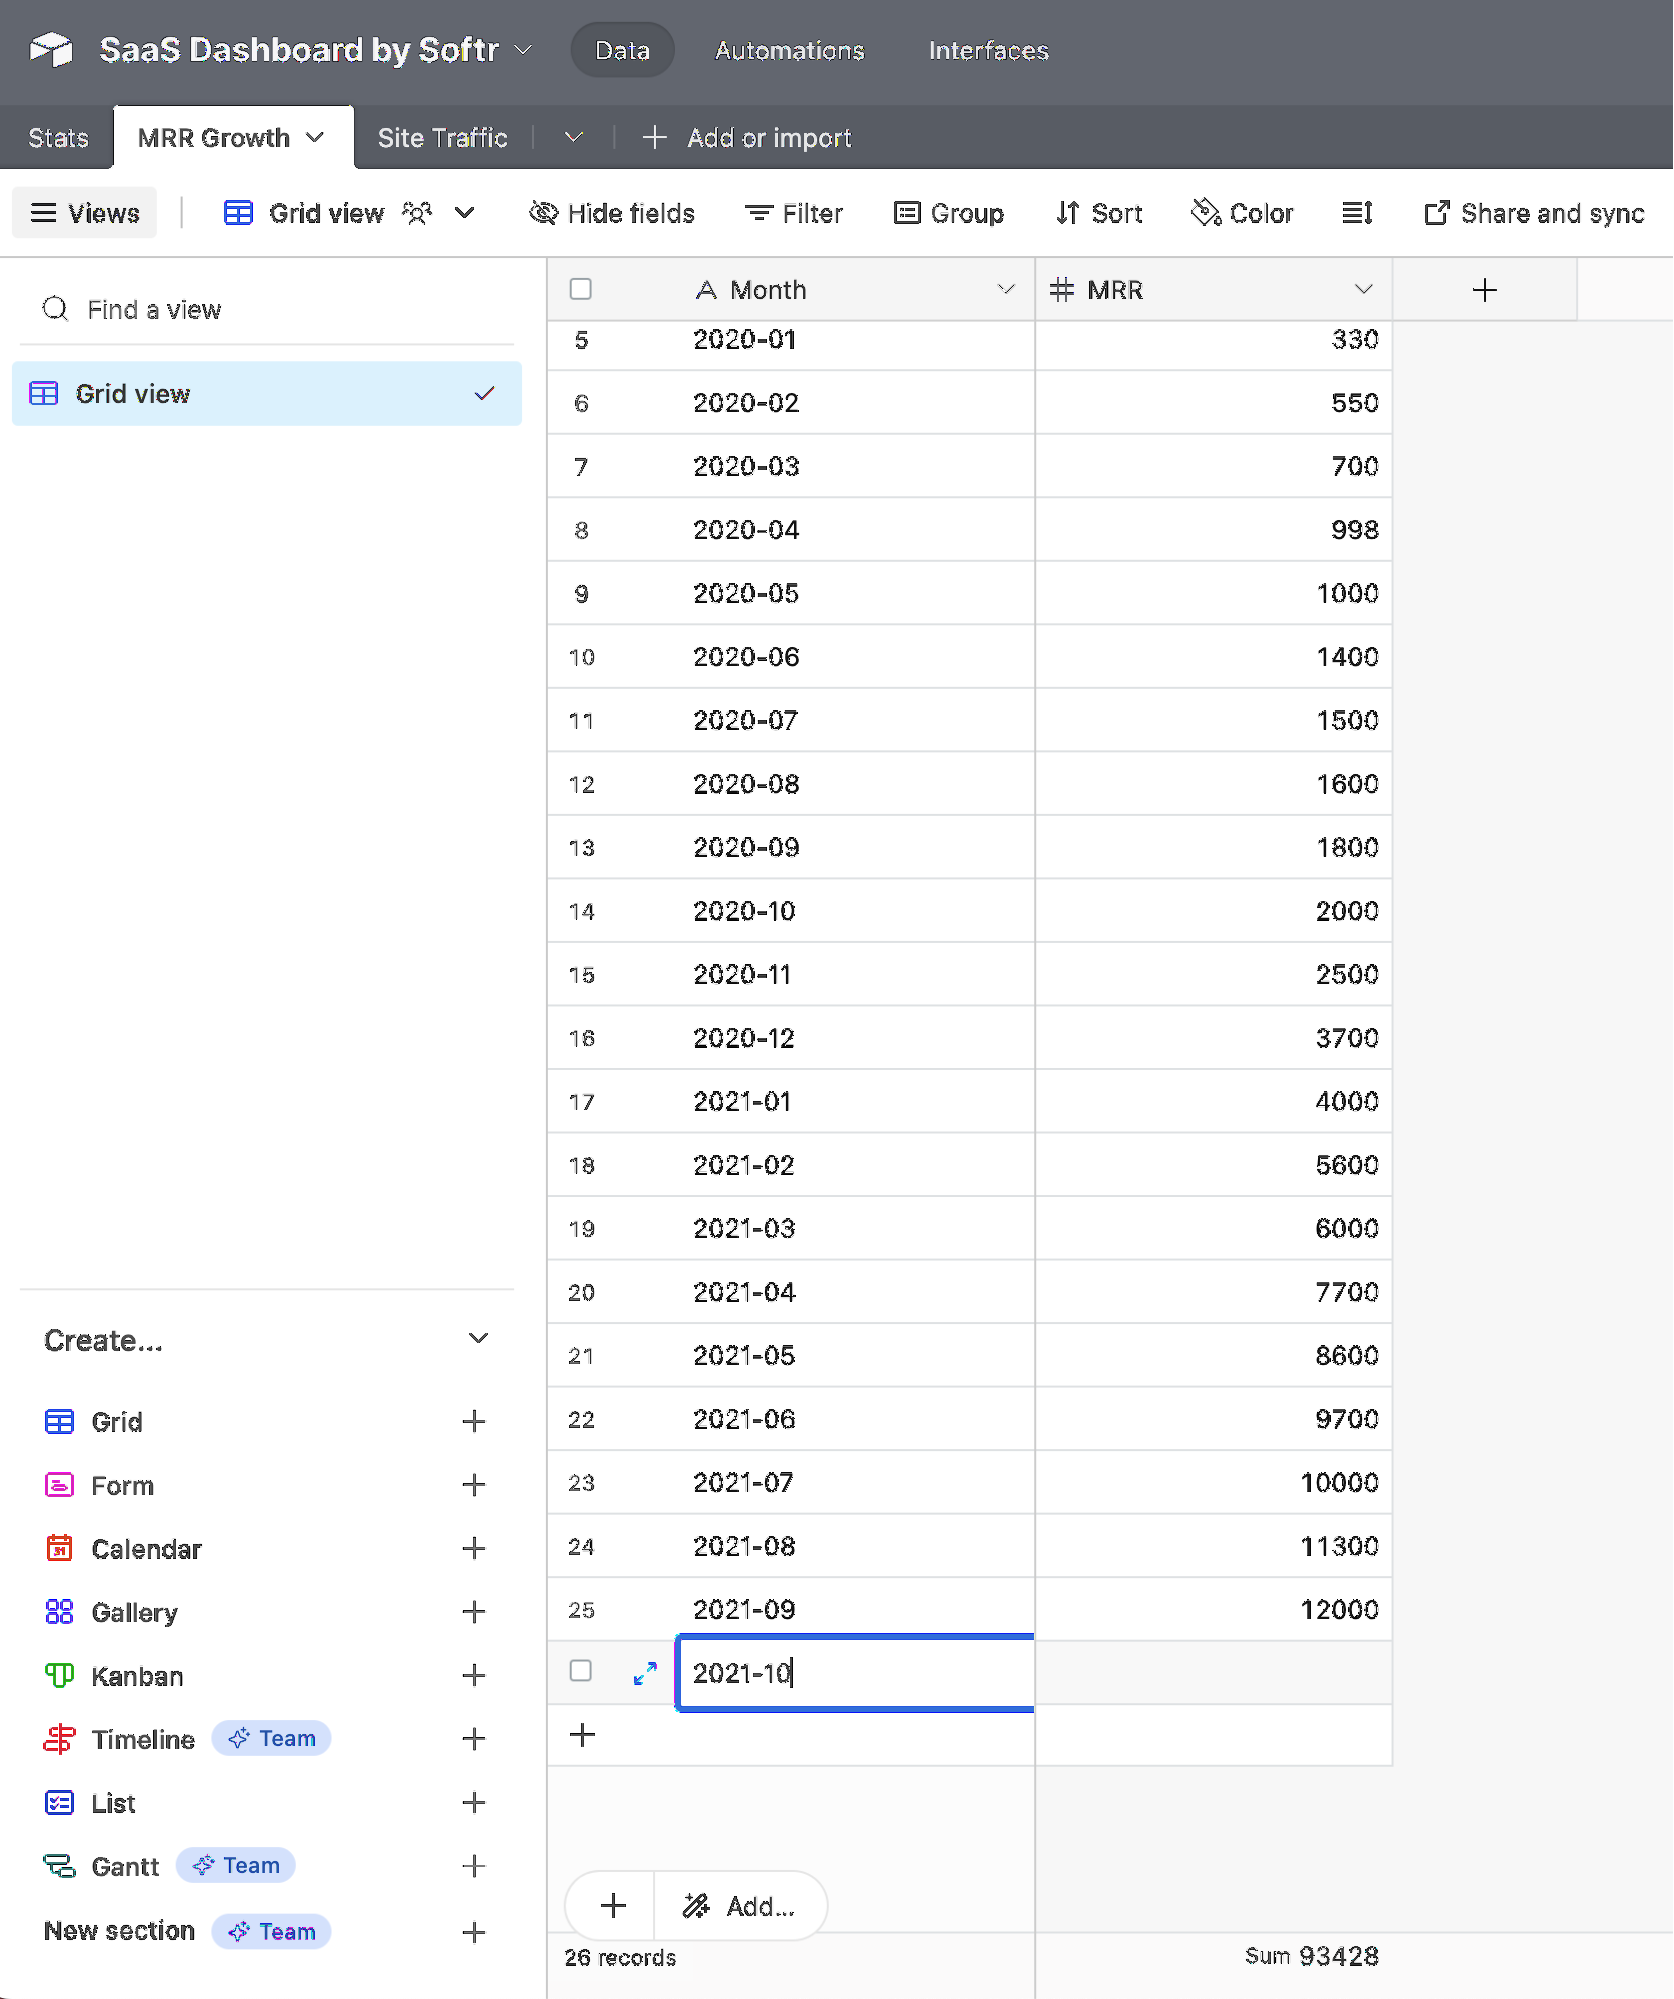
Adding data to Airtable.
Step 8.2: Adjust your blocks’ settings
When you click on a pre-built block, a sidebar will open on the right side of the screen. Navigate through the tabs to adjust the source and filtering settings, adjust the displayed content and customize the style and visibility.
Editing pre-built blocks in Softr Studio.
Step 8.3: Add new blocks
On the top-right corner of the Softr Studio page or at the beginning and the end of each block you will find a plus sign. Click on it to add a new block. Choose the adequate block and adjust its settings as shown in the previous step.
Adding pre-built blocks in Softr Studio.
Step 9: Publish your app
Now that you have everything set, publish your app. Click the “Publish” button on the top bar.
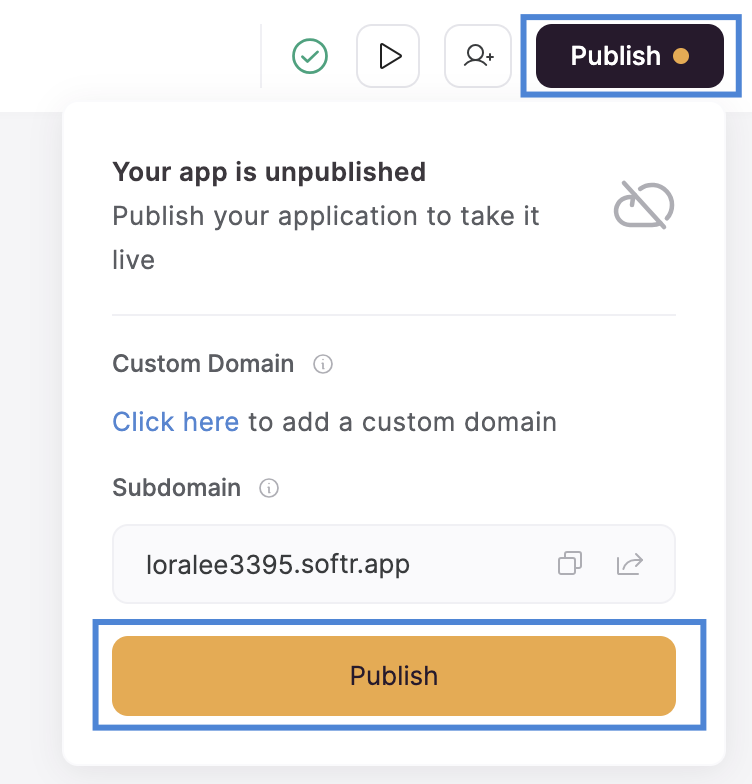
Publishing a Softr app.
Step 10: Share your app
You have created a dashboard integrated with your Airtable data. You can now share it with your team or stakeholders.
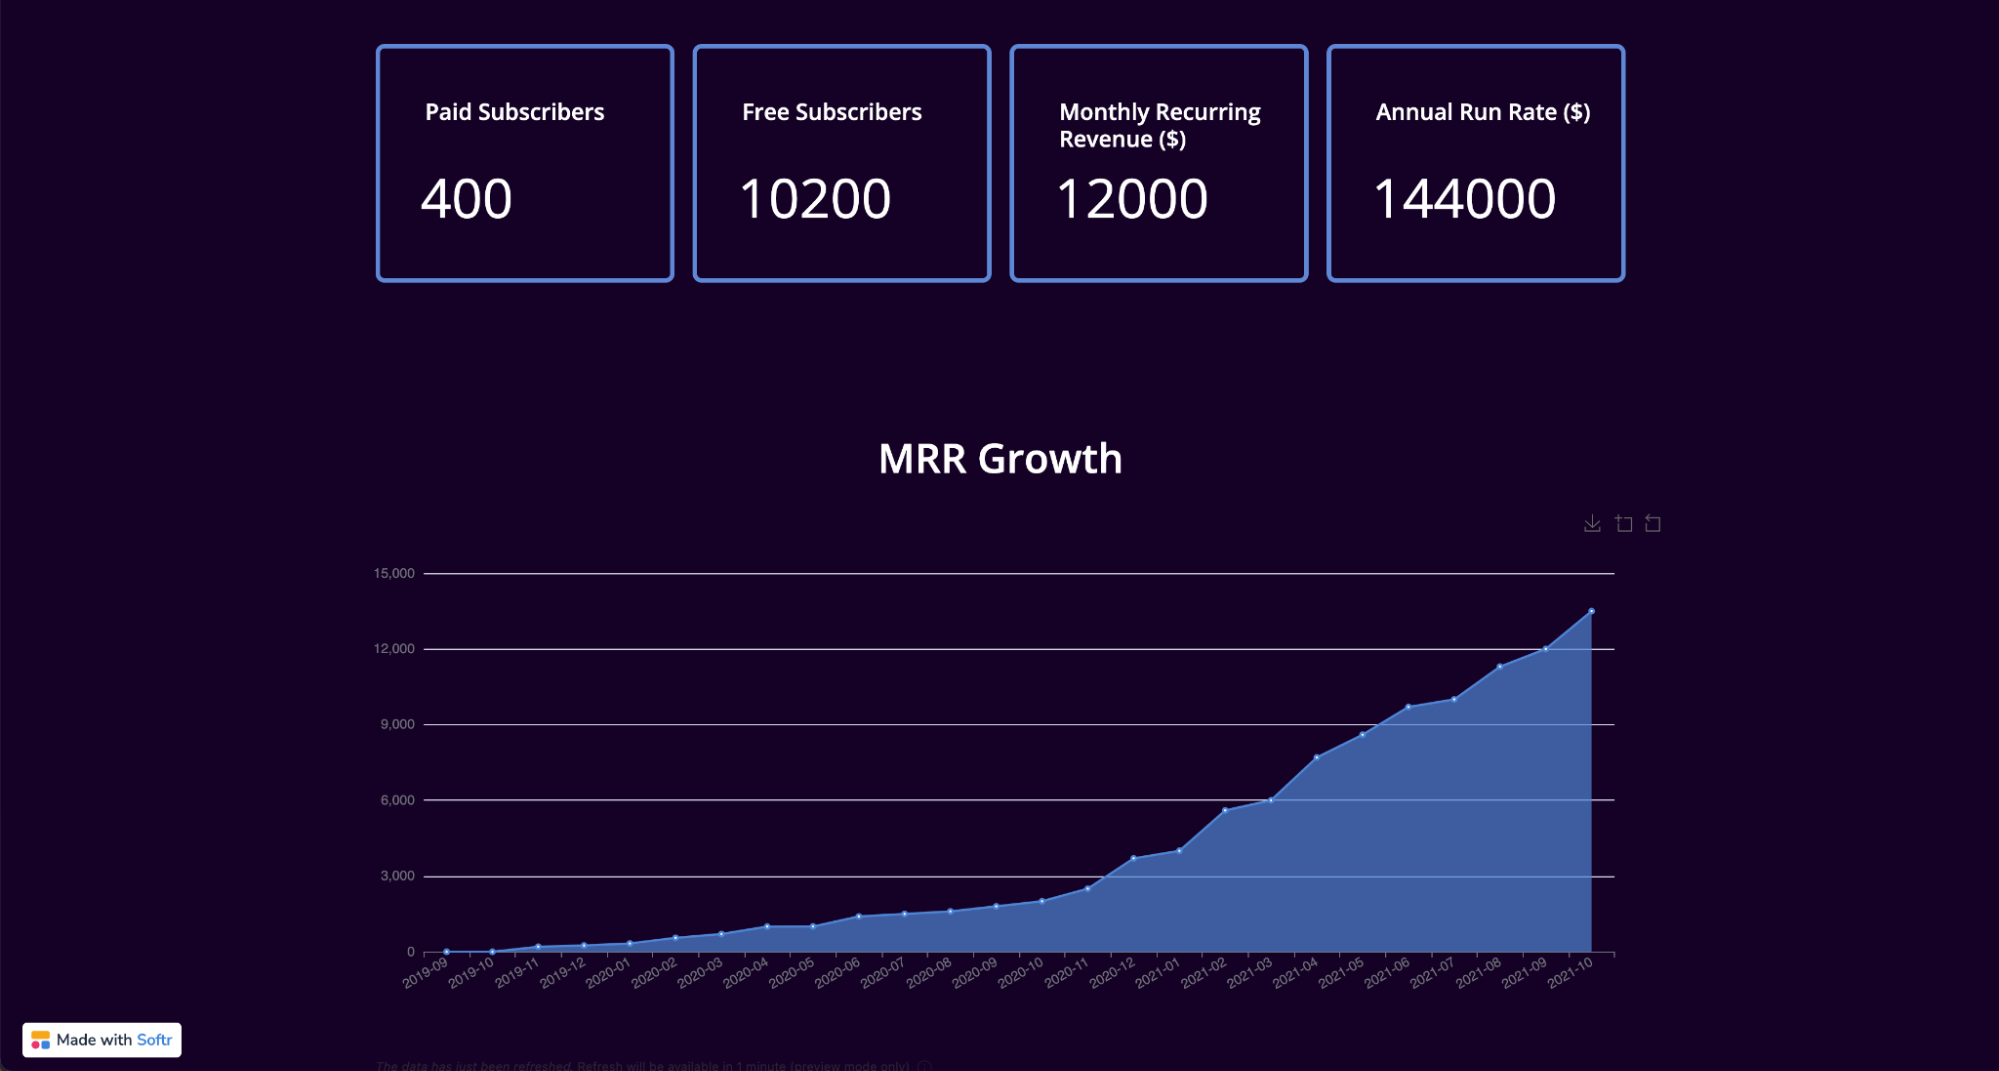
Screenshot of a dashboard made with Softr.
Making sense of data is tough when all you can see are endless rows.
Get dynamic data visualization with Softr graphs and charts.